Overview
CSO Census 2022 · Small Area Population Statistics
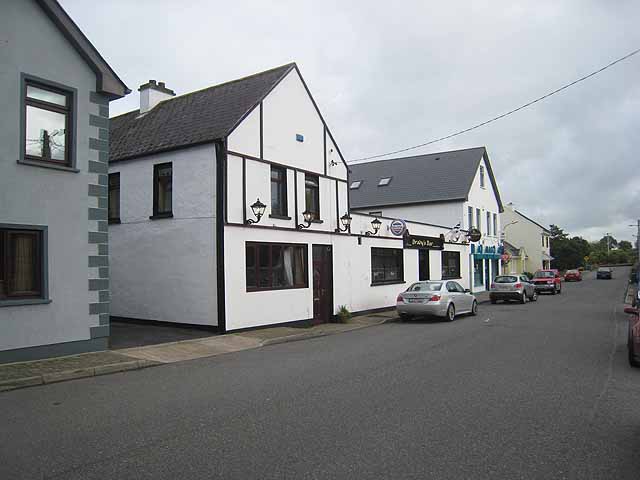
Population
373
Census 2022
Owner occupied
69.3%
National: 65.9%
Crime rate per 1,000
19.0
National avg: 54.1
Carney has a population of 373 according to Census 2022. Compared to national averages, it stands out for a higher-than-average third-level education rate (58.2% vs 39.2% nationally); a higher-than-average share of under-14s (27.3% vs 19.7% nationally); a lower-than-average share of over-65s (5.9% vs 15.1% nationally).
Age Profile
CSO Census 2022 · Table 1 population by age
Age distribution
Carney vs national average (%)
Carney
National
What the age data tells us: Carney has a notably young population, with 27.3% aged 0–14 compared to 19.66% nationally. This suggests a high proportion of young families — often associated with newer housing developments and strong school provision.
Under 14
27.3%
National: 19.7%
65 and over
5.9%
National: 15.1%
Male / Female
49.3% / 50.7%
National: 49.4% / 50.6%
Economic Status
CSO Census 2022 · Table 8 principal economic status (aged 15+)
Economic status
Carney vs National (%)
Carney
National
vs national average
At work
Retired
Student
Looking after home/family
Third Level Education
CSO Census 2022 · Table 10 highest level of education completed
vs national average
Third level education
Notable: Carney has a significantly higher third-level qualification rate than the national average — 58.2% vs 39.24%. This points to a highly educated, knowledge-economy workforce.
Crime & Safety
CSO Recorded Crime Statistics · Garda subdistrict level · 2024
Crime rate per 1,000
19.0
National avg: 54.1
vs national average
65% below national average
2024 recorded crime
3-year avg rate
18.7
Per 1,000 · 2022–2024
Lower than average crime: The Grange Garda subdistrict, which covers Carney, records a crime rate of 19.0 per 1,000 — 65% below the national average of 54.06.
Crime rate is based on recorded incidents in the Grange Garda subdistrict (population 5,430), which covers Carney and surrounding areas. Data: CSO Recorded Crime Statistics.
Commuting
CSO Census 2022 · Table 11 departure times & travel mode
Departure time for work / school
Carney vs National (%)
Carney
National
How people travel to work
Carney vs National (%)
Carney
National
vs national average
Work from home
Public transport
Car / van
Nationality & Ethnicity
CSO Census 2022 · Table 2 nationality and ethnicity
Citizenship / nationality
Carney vs National (%)
Carney
National
Ethnicity
Carney vs National (%)
Carney
National
vs national average
Irish citizen
White Irish ethnicity
Religion
CSO Census 2022 · Table 4 religion
Religion
Carney vs National (%)
Carney
National
vs national average
Catholic
No religion
Irish Language
CSO Census 2022 · Table 3 Irish speakers aged 3 and over
Can speak Irish
45.5%
National: 39.83%
Speak Irish daily outside school
1.1%
National: 4.11%
vs national average
Can speak Irish
Daily outside school
Housing & Tenure
CSO Census 2022 · Table 6 type of occupancy and accommodation
Owner occupied
69.3%
National: 65.9%
Private renting
22.6%
National: 18.0%
Social housing
5.1%
National: 10.0%
Ownership breakdown
Owned with mortgage
Owned outright
Dwelling type
House/Bungalow
Flat/Apartment
Cars per household
No car
Two or more cars
Health
CSO Census 2022 · Table 12 self-reported general health
Good or very good health
93.0%
National: 82.9%
Fair health
5.4%
National: 8.6%
Bad or very bad health
0.5%
National: 1.7%
Smokers
8.8%
National: 17.03%
Self-reported health
Carney vs National (%)
Carney
National
Health: 93.0% of residents in Carney report good or very good health, above the national average of 82.89%.